Cepheo Foundation
Our custom modules
HowTo
License overview
Batch jobs
Business events
Foundation release highlights
Foundation history
Base.2022.2.2.10
Base.2022.2.2.11
Base.2022.8.2.15
Base.2022.8.2.16
Base.2022.8.2.19
Base.2022.11.2.21
Base.2024.10.2.65
Base.2025.2.3.2
Base.2025.2.3.4
Base.2025.2.3.5
Base.2025.3.3.6
Base.2025.11.3.14
Base.2026.1.3.15
Base.2026.2.3.17
Release notes Foundation
What is Cepheo Foundation
Cepheo Business Documents
Business Document examples
Business Documents configuration
General for all documents
Sales order configuration
Sales invoice
Sales packing slip
Purchase order
Project invoice
Quotation
Interest note
Work report
Dynamic payment information
Release highlights Business Documents
Release notes Cepheo Business Documents
Cepheo Currency Import
Exchange rate provider
Triangulation
Release highlights Currency Import
Release notes Currency Import
What is Cepheo Currency import
Cepheo Engineering
Engineering setup
Engineering parameters
Engineering global parameteres
Change notification parameters
Classification Codes Setup
Item property setup
Manufacturer Setup
Material Quality Setup
Product setup
Spare Parts Setup
Released Item Setup
How to use Engineering
Release highlights Engineering
Engineering history
Rev.2022.5.2.5
Eng.2022.5.2.11
Eng.2022.5.2.12
Eng.2022.9.2.13
Eng.2022.11.2.14
Eng.2022.12.2.16
Eng.2023.1.2.17
Eng.2023.1.2.18
Release notes Cepheo Engineering
What is Engineering
Cepheo Estimator Metrics
Estimator metrics configuration
Estimator metrics analyze
Release highlights Estimator metrics
Release notes Estimator metrics
Cepheo Expense
Cepheo Expense Power App
Cepheo Human Resources
Setup HR extension
Use HR extension
Release highlights HR extension
Release notes HR extension
What is Human Resources Extension
Cepheo Installation
How to use Installation
Setup Installation
Release highlights Installation
Release notes Installation
Cepheo Ledger Import
How to use Ledger Import
Setup of Ledger Import
Release highlights Ledger Import
Release notes Ledger Import
Cepheo Payment Certificate for Construction
Release highlights Payment certificate for construction
Release notes Payment Certificate for Construction
What is Cepheo Payment Certificate for Construction
Cepheo Payroll Integration
Setup of payroll
How to use payroll
Release highlights payroll integration
Release notes Payroll Integration
What is Cepheo Payroll
Cepheo Price import
Cepheo Project Control
Risk setup and use
Subscription setup and use
Project invoice proposal
Release highlights Project extension
Release notes Project control extension
What is Cepheo project control
Cepheo Project Cost Allocation
Release highlights Project Cost Allocation
Release notes Project cost allocation
What is Cepheo Project Cost Allocation
Cepheo Project Management
Capitalized interest
Parameter Setup for Capitalized Interest
Run Capitalized interest wizard
Post Captitalized Interest Transactions
Capitalized interest Overview
Forecast distribution
Release highlights Project management
Pjm.2026.4.3.11
Pjm.2025.8.3.1
Pjm.2025.04.2.1
Pjm.2026.2.3.7
Pjm.2026.6.3.14
Project Management history
Release notes Project management extension
What is Cepheo Project Management
Cepheo Punchout procurement
Cepheo Sales Integration
Use sales integration
Setup sales integration
Release highlights Sales integration
Relase notes Sales Integration
Cepheo Service Integration
Use service integration
Setup service integration
Service integration parameters
Work order lifecycle models
Maintenance workers
Cepheo power platform solution
Setup Cepheo Asset management app in Resco
Virtual entities
Release notes Service Integration
Cepheo Shipment Booking
How to use Shipment booking
Notification contacts
Consolidate shipment bookings from Create Shipment booking dialog
Maintain content lines on a Container on a Shipment booking
Shipment booking setup
Shipment booking external values
Convert addresses and recipients to address quick ID's
Convert label
Convert Carrier, Carrier services and/or Additional service
Convert country, state and county
Convert currency code
Convert print favorite
Convert shipment payer account
Convert (WHS) Container types
Convert shipment booking status
Convert security group
Shipment booking parameters
Document transformations
Shipment booking senders
Shipment booking labels
Shipment booking print favorites
Shipment booking security group (nShift Delivery)
Carrier container types
Shipment booking cost rule
Printers and Printer locations
Import Carrier
Export declaration in Shipment booking
Shipment booking app setup
Release highlights Shipment booking
Release notes Shipment Booking
What is Shipment booking
Cepheo Subscription
Setup of subscription
How to use subscription
Release highlights Subscription
Release notes Subscription
Cepheo Test and Certification
Certification and testing
Release highlights Test and certification
Release notes Test and Certification
Cepheo Timesheet
Timesheets
Hour balance
Timesheet extension release highlights
Timesheet extension history
Ts.2022.3.2.15
Ts.2022.3.2.16
Ts.2022.4.2.17
Ts.2022.4.2.18
Ts.2022.4.2.19
Ts.2022.5.2.22
Ts.2022.9.2.24
Ts.2023.2.2.30
Ts.2023.2.2.31
Ts.2023.4.2.33
Ts.2025.3.4.9
Ts.2025.04.4.14
Ts.2026.2.4.21
Release notes Timesheet extension
What is Cepheo Timesheet
Cepheo Vendor Catalog
Cepheo Quality and Sample Management
What's new or changed in Quality and Sample Management
Release notes Cepheo Quality and Sample Management
Cepheo Quality Sample Management Version 2025.11.1.9
Cepheo Quality Sample Management Version 10.42.66.2
Cepheo Quality Sample Management Version 10.42.66.3
Cepheo Quality Sample Management Version 2026.3.1.133
Cepheo Quality Sample Management Version 2025.12.1.40
Cepheo Quality Sample Management Version 2026.5.1.142
Cepheo Quality Sample Management Version 2026.6.1.151
Cepheo Quality Sample Management Version 2026.1.1.74
Cepheo Quality Sample Management Version 2026.4.1.139
Cepheo Quality Sample Management Version 2026.2.1.101
Introduction to Quality and Sample Management
What is Cepheo Quality and Sample Management
Terms and abbreviations
Limitations and Compatibility with Standard Features
Navigation
Advanced Quality Control
Setup
Advanced Quality Control
Fail immediately
Update Advance Quality Order Phase based on Quality Order Status
Register test results
Advanced quality work when merging batches (reference type = Inventory)
How to transfer Out of Spec test results to batch attributes
Reservation concept for Batch and warehouse enabled products
View test results
Sample management
Batch disposition master
Disposition code not allowed for location
Preparing disposal of archived samples
Frequencies
Advanced quality associations with ref type different from ‘Quality sample’
Stability testing
Printing of sample labels
Advanced quality associations with reference type ‘Quality sample’
View item tracing
Printing of quality order report
How to transfer test results from bulk batch to Finished Goods batch
Item sampling
Transfer disposition code from Bulk product to finished goods
Manual transfer of test results to batch attributes
Automatic creation of Non-conformance orders
How to enable automatic transfer of test results to batch attributes
Quantities field on Advanced Quality orders
Cepheo Advanced Quality and Sample management and Microsoft Test Instrument Calibration.
Disposition code for location “Production input”
Calculation method
Warehouse management application
Overview - WMS app
Set up a mobile device menu items for receiving processes
Set up a mobile device menu item for changing batch information
Set up a mobile device menu item for registering or adding test results
Set up a mobile device menu item for setting a sample status
Set up a mobile device menu item for changing license plate disposition code
Set up a mobile device menu item for moving sample type
Set up a mobile device menu item for creating a sample
Configure detours for steps in mobile device
Automatic release of license plates
Quality Work Forecasting
Batch Manufacturing Date
Update of manufacturing date
Setup of tracking number group
Update of Expiration Date
Batch Manufacturing Date
License Plate Disposition Code
Formula Yield Extension
Electronic signature
Quality workspace
Quality workspace
Tab page Advanced quality orders/test results
Tab page Quality samples
Tab page Summary
Data entities
Security
Extension points
Cepheo Global Data Management
Installation
Global data management setup
Validate
Example
Refresh fields setup
Create a data table from a data entity
Recreate company updates
Relation
Table browser
Table setup
InventItemGroupItem
Default values
InventModelGroupItem
Fields setup
Push records
Selection management
Company Distribution
Global data management setup
Record updates
Periodic
Batch push data
Batch push data - multi-threaded
Clean up Event log
Relating existing records
Clean up Record updates
Active is set to Yes
Periodic
Update triggers
Refresh fields setup
GDM monitoring
Overview per company
Managing data
GDM Security setup
Cepheo GDM setup
The company groups setup
Global data management owner
Setting the Cepheo GDM Parameters
Cepheo GDM setup
Known issues
Example: Create new customer
Release highlights Cepheo Global Data Management
Cepheo Global Data Management version 2026.3.1.74
Cepheo Global Data Management version 2025.12.1.38
Cepheo Global Data Management version 2026.3.1.83
Cepheo Global Data Management version 10.42.66.1
Cepheo Global Data Management version 2026.6.1.89
Cepheo Global Data Management version 2025.11.1.7
What is Cepheo Global Data Management
Release notes Cepheo Global Data Management
Cepheo Shipping Packaging Management
Terms and abbreviations
Release highlights Cepheo Shipping Packaging Management
Release notes Cepheo Shipping Packaging Management
Cepheo Shipping Packaging Management Version 2026.6.1.19
Cepheo Shipping Packaging Management version 2025.11.1.3
Cepheo Shipping Packaging Management Version 2026.2.1.5
Cepheo Shipping Packaging Management Version 2026.3.1.9
Cepheo Shipping Packaging Management version 2025.12.1.4
Cepheo Shipping Packaging Management version 2026.5.1.18
Cepheo Shipping Packaging Management Version 2026.5.1.17
Introduction to Cepheo Shipping Packaging Management
What is Cepheo Shipping Packaging Management
Cepheo Shipping Packaging Management – Pain Points & How the Module Solves Them
Shipping Packaging framework
Shipping Packaging framework
Feature Management for Cepheo Shipping Packaging Management
Packaging types
Packaging groups
Shipping packaging management setup
Packaging management for products
Advanced packaging management for products
Packaging item groups
Packaging management for custoners/vendors
Packaging management for transfer orders
Packaging management for Intercompany and direct delivery
Packaging management for carriers
Packaging management on a sales/purchase order
Packaging management on sales return orders (RMA)
Packaging management on loads/shipments
Packaging management manually on a sales/purchase order
Packaging management automated as part of the sales/purchase order packing slip update
Packaging management as part of transfer orders
Packaging management as part of transfer journals
Linking registrations to shipment/loads
Reporting packaging without order reference
Reporting packaging transactions to a pool owner
Setup of Packaging Pools
Using mobile device for registration of packaging
Packaging on-hand
Settle packaging
Suggestion production process
Packaging filters and overview
Taxes in Transfer Orders – Cepheo Shipping & Packaging Management
License configuration key
License
Security
Data Management - Entities
Cepheo Product Documentation Management
Security
Document overview groups
Release highlights Cepheo Product Documentation Management
Cepheo Product Documentation Management Version 2026.6.1.10
Cepheo Product Documentation Management Version 2026.5.1.7
Data entities
License configuration key
Product data sheets and batch certificates
Data sheets (PIM\Common\Data sheet)
Basic setup
Printing certificates for a batch
Additional information on data sheets and certificates
Electronic signature – Approve data sheet
Document-specific information
Product data sheets and batch certificates
License
Terms and abbreviations
Release notes Cepheo Product Documentation Management
What is Cepheo Product Documentation Management
Cepheo Product Data Management Extension
Security
BOM Comparison (PIM\Common\Released products)
License configuration key
Terms and abbreviations
Data entities
Customer-specific order settings (PIM\Common\Released products)
Product lifecycles
Release highlights Cepheo Product Data Management Extension
License
What is Cepheo Product Data Management Extension
Release notes Cepheo Product Data Management Extension
Cepheo Extended Production Handling
Module overview
Automatic reporting as finished for sub-productions
Concept
Prerequisites and setup
Reporting quantity as finished from finished product
Mix pools
Automatic reporting as finished for sub-productions
Ending productions from finished product production
Reporting negative quantity as finished from finished product (roll-back)
Reporting overproduced quantity as finished from finished product
Supported process flow
Automatic route consumption
Consolidated batchorders
Consolidated batchorders
Choosing planned bulk orders only
Choosing planned pack and bulk orders
Choosing planned pack orders only
Menus for the planner
Working with the "Firm consolidate batch orders" form
Working with the "Consolidated batch order" form
Quantity view for consolidated batch order
Data entities
Security
Release highlights Cepheo Extended Production Handling
Release notes Cepheo Extended Production Handling
Cepheo Extended Production Handling version 2025.11.1.3
Cepheo Extended Production Handling version 2025.12.1.4
Cepheo Extended Production Handling Version 2026.3.1.8
Cepheo Extended Production Handling Version 2026.5.1.14
Cepheo Extended Production Handling version 2026.5.1.16
License key
License configuration key
What is Cepheo Extended Production Handling
Cepheo Information Display for Batch Products
What's new or changed in Cepheo Information Display for Batch Products
Introduction to Cepheo Information Display for Batch Products
What is Cepheo Information Display for Batch Products
The pains addressed by Cepheo Information Display for Batch Products
Batch Information Display
Batch information display setup
Batch Information Display
Batch information display for on-hand
Batch information display groups
Item batch information display group
Batch information display for reservation
Batch information display on ‘Batches’ form
On-hand list and display dialog
Batch information display for sales order add lines-function
Batch information display for Batch merge
Case: On a release product, a specific attribute needs to be shown.
Security
Entities
Cepheo Advanced Customer Approval
What's new or changed in Cepheo Advanced Customer Approval
Introduction to Cepheo Advanced Customer Approval
Advanced Customer Approval (ACA)
ACA Inquiry forms
Printing sales order
Setup for Advanced Customer Approval
Show only approved products
Using ACA information for purchase
Advanced Customer Approval (ACA)
ACA and Intercompany
ACA for trade agreements (Prices)
ACA for sales quotations
ACA for sales agreements
Customer exclusion
Security
Terms and abbreviations
License configuration key
Data entities
Cepheo Advanced Vendor Management
License
Advanced Vendor Approval (AVA)
Purchase order
Purchase agreement
AVA for trade agreements (Prices)
Advanced Vendor Approval (AVA)
Setup of AVA's on a released product
Source and destination control
Release highlights Cepheo Advanced Vendor Management
License configuration key
Security
Vendor exclusion
Data entities
Vendor Audit Management
Audit records
Vendor Audit Management
Number sequence for Vendor Audit
Vendor audit score
Vendor audit status
Audit requirement
Vendor and manufacturer certifications
Terms and abbreviations
Release notes Cepheo Advanced Vendor Management
What is Cepheo Advanced Vendor Management
Release notes AVM
Cepheo Label Extension for Warehouse Management
What's new or changed in Cepheo Label Extension for Warehouse Management
Cepheo Label Extension for Warehouse Management Version 2026.3.1.2
Release notes Cepheo Label Extension for Warehouse Management
Introduction to Cepheo Label Extension for Warehouse Management
Warehouse document routing layout
Label viewer tool
Security
Terms and abbreviations
License
Entity
Configuration keys
AX2012
Cepheo MVA-melding
MVA Setup
MVA Reporting
Step 4: Reporting
Step 4 | Section 1: Tax reports
Step 4 | Section 2: Standard tax codes
Step 4 | Section 3: Tax specifications
Step 4 | Section 4: Report remark
MVA Multicompany setup
MVA Intercompany setup
MVA Intercompany Tax report
Cepheo SAF-T reporting
Cepheo Software Licensing
- All Categories
- Cepheo Quality and Sample Management
- Quality workspace
- Tab page Advanced quality orders/test results
Tab page Advanced quality orders/test results
 Updated
by Dawid Kaczmarek
Updated
by Dawid Kaczmarek
When setting up this tab page, up to 6 graphical elements can be shown. The user can basically select between two type of elements, one type is designed to be a Top 10 presentation of the selected data, and the other element is designed to present selected data over time.
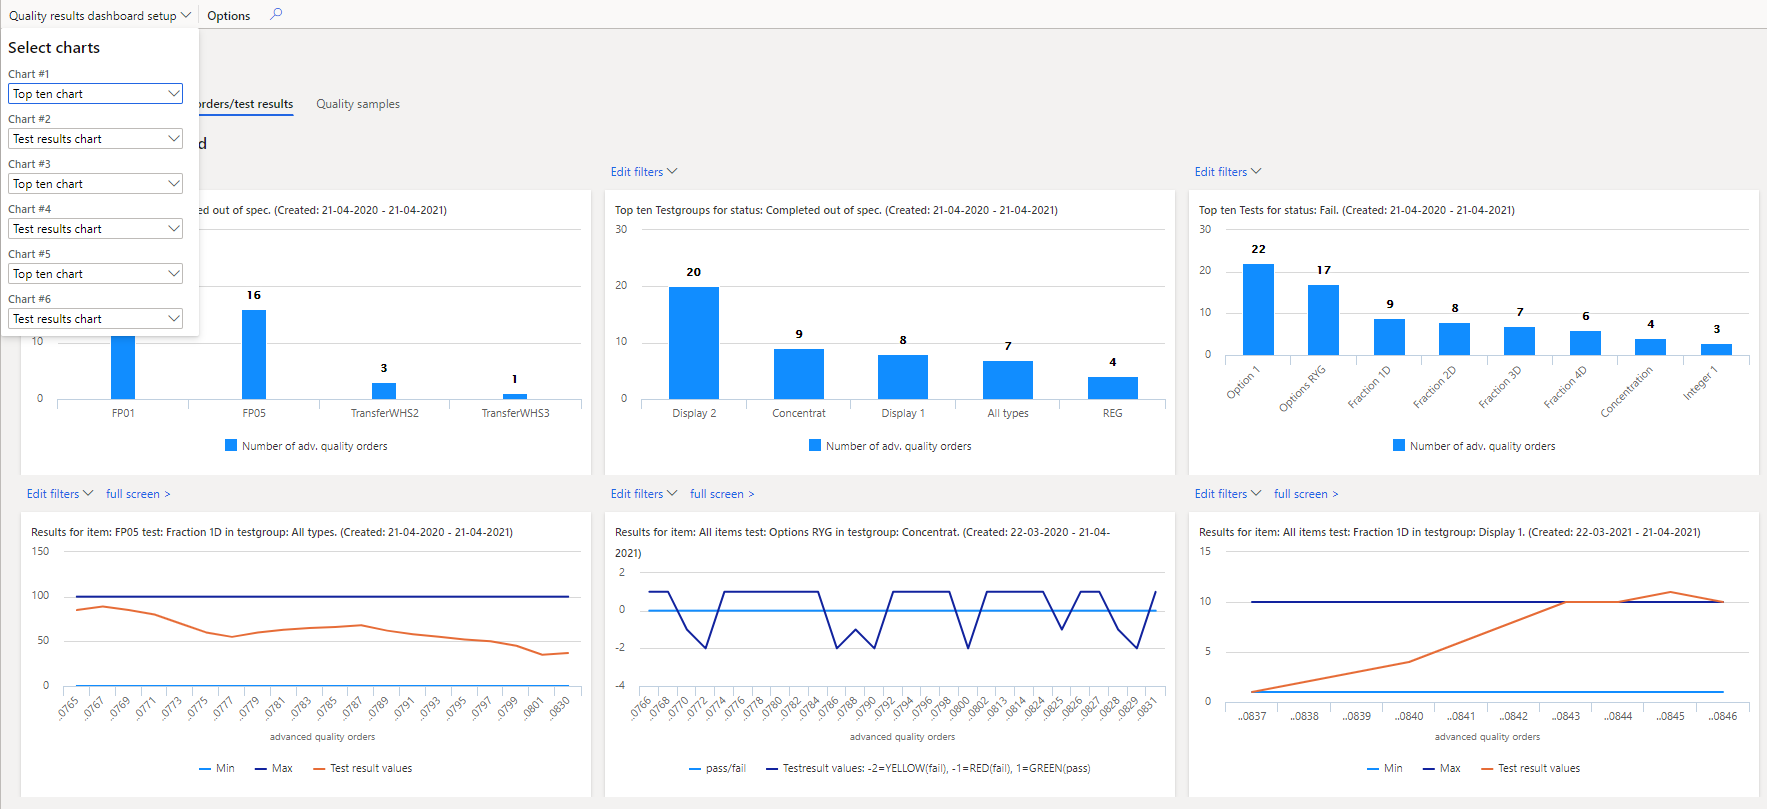
The selection of elements to be shown is performed by the menu ‘Quality results dashboard setup’ by selecting the wanted type of element. The selection can have the following values: Not used (no element is shown); Top ten chart (a chart showing the 10 highest values from the selected data); Test results chart (a chart showing test results from advanced quality order lines)
Each type of element can be set up by activating the menu ‘ Edit filter ’. If filter setup is missing, or data cannot be found, the element will show the text [Press ‘Edit filter’ to set up search parameters for this chart].
When activating ‘Edit filters’, it can be chosen to view all filters, date filters or measure filters. When showing filters, the same selection can also be performed by using the dropdown on ‘the ‘Show filters’, from here the ‘Hide all’ filters can also be selected.
The actual selected filters and date selection combination is shown in the top section for each graphical element.
Element type = Top ten chart
Using the element type = ‘Top ten chart’, the menu ‘Edit filters’ will provide the option to select between: All, Dates or Measures.
When editing the filter setting for the ‘Top ten chart’ element, the following setup will be available:
| Field | Value |
| Show filters | Show all – All filters will be shown Hide all – All filters will be hidden Dates – Only date filters will be shown Measures – Only measure filters will be shown |
| Top ten type | Items – Calculation will count for/apply to items Test groups – Calculation will count for/apply to test groups Tests – Calculation will count for/apply to tests |
| Status type | If top ten type = Items, the counting can be done for [Completed out of spec, Completed in spec, Fail, Pass] If top ten type = test groups, the counting can be done for [Completed out of spec, Completed in spec, Fail, Pass] If top ten type = tests, the counting can be done for [Fail, Pass, Incomplete] |
| From date | The date from which the data is being shown |
| To date | The date to which the data is being shown |
| Quality order date | The type of date being selected as base for searching data to be presented. The following types of date are available for advanced quality orders: [Created, Validated time, Phase change date/time, Expected start date, Expected date of completion, Exp. completion Priority 1] |
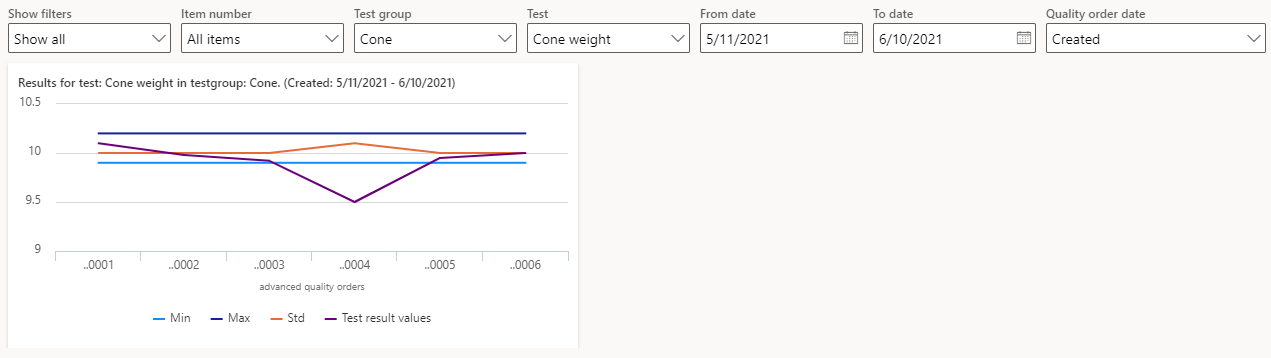
Element type = Test result chart

By default, all categories are shown, but the individual elements (Min, Max, Std, Test result values) can be deselected/selected by clicking the individual category shown below the horizontal axis.
When editing the filter setting for the ‘Test result chart’ element, the following setup will be available:
| Field | Value |
| Show filters | Show all – All filters will be shown Hide all – All filters will be hide Dates – Only date filters will be shown Measures – Only measure filters will be shown |
| Item number | All items – Calculation will be done across all items represented by the period being selected. If a specific item is selected, only data for the selected item will be presented. Only items used in advanced quality orders available in the selected period will be available. |
| Test group | Select a test group from where to show data. Only test groups used in advanced quality orders available in the selected period will be available. |
| Test | Select a test from where to show data. Only tests used in selected test group for advanced quality orders available in the selected period will be available. |
| From date | The date from which the data is being shown |
| To date | The date to which the data is being shown |
| Quality order date | The type of date is being selected as the basis for searching for data to be presented. The following types of dates are: Available for advanced quality orders: Created, Validated time, Phase change date/time, Expected start date, Expected date of completion, Exp. completion priority 1 |
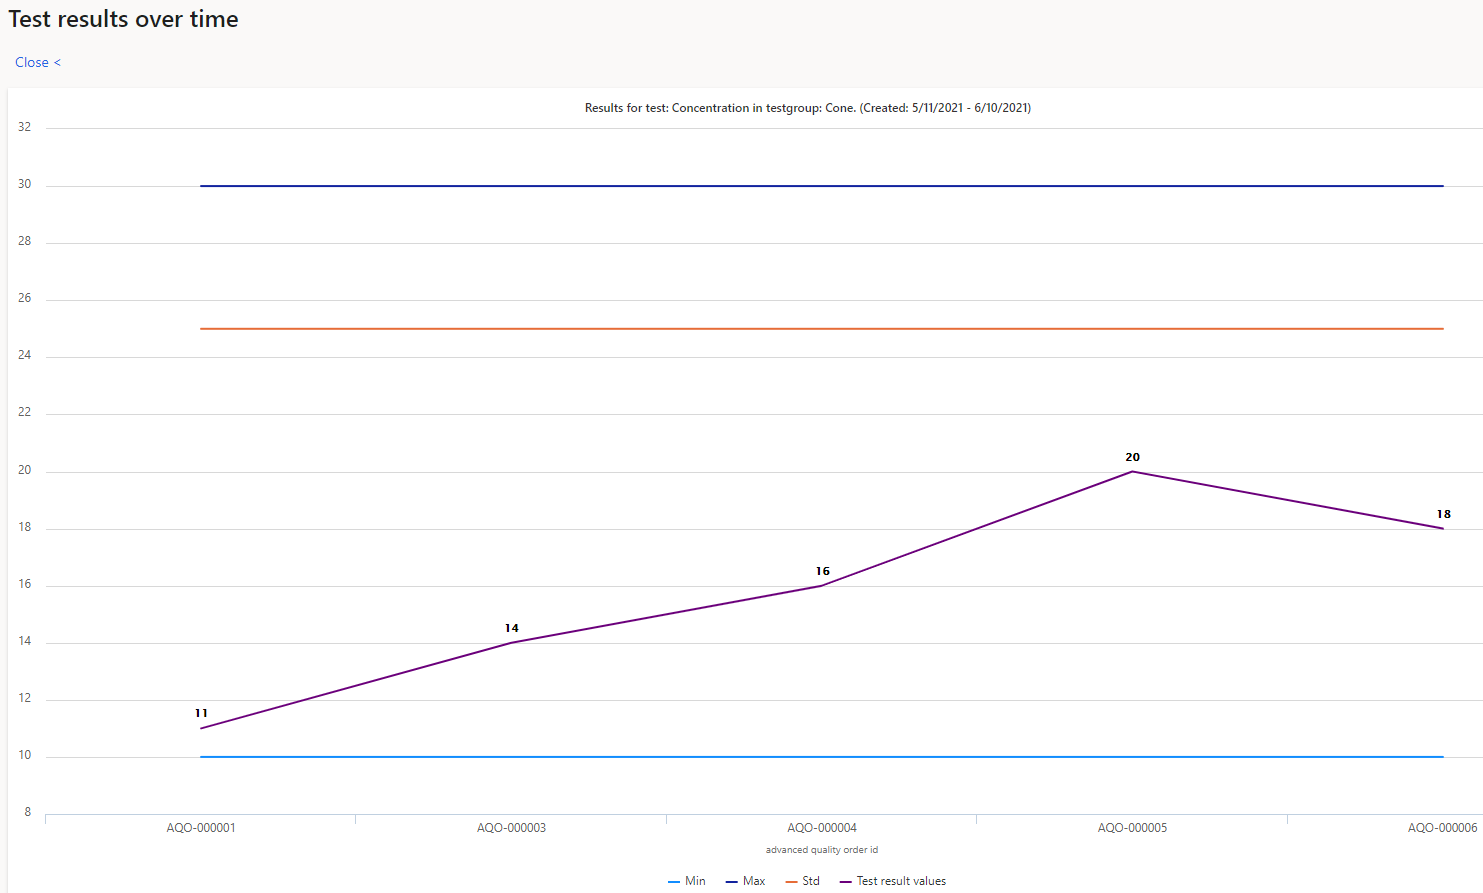
In cases where a high volume of data is making it difficult to see the details wanted from the graph, a full screen presentation can be selected. This will open the element with the same data and setup in a full screen version.